In this post, another analysis carried out by MoviTUR members during the first months of the pandemic is presented. This research is about the impact of COVID-19 on our mobility during the lockdown and has been made by Abid Al Akioui Sanz and Andrés Monzón, from TRANSyT.
On March 14th, 2020, the Spanish Government declared the state of alarm in view of the health crisis triggered by the COVID-19 pandemic. This legal prevision began with a lockdown that lasted two months, which was followed by a phased easing of the lockdown to control the return to the new situation. This led to the end of the state of alarm on June 21st, 2020.
This state of alarm brought about a precedent-shattering change in the habits and mobility of the citizens at a national level. Given the unusual situation, multiple public agencies have collected data about the impact of the pandemic on the habits of the population.
Among the agencies, the Spanish National Statistical Institute (INE) stands out as one that publicly shares a great amount of the collected data. The INE’s provided information consists of numbers related to the sociodemographic, economic, health and mortality realms, as well as mobility data, which is specifically observed in the present publication.
Mobility data finds its source in anonymized mobile phone records with samples from more than 80% of mobile phones from every corner of Spain. Figures provided by the census on January 1st, 2019 complement mobility data.
In order to gather this information, the INE has divided the national territory into 3,200 mobility areas, which consist of units created by this body that are composed of groups from 5,000 to 50,000 inhabitants, thus becoming a more homogeneous tool than municipalities.
Consequently, the areas of residence are identified as those where the phone is located between 0:00 and 6:00 and the destination areas as the most frequent ones where the phone is between 10:00 and 16:00 for more than two hours.
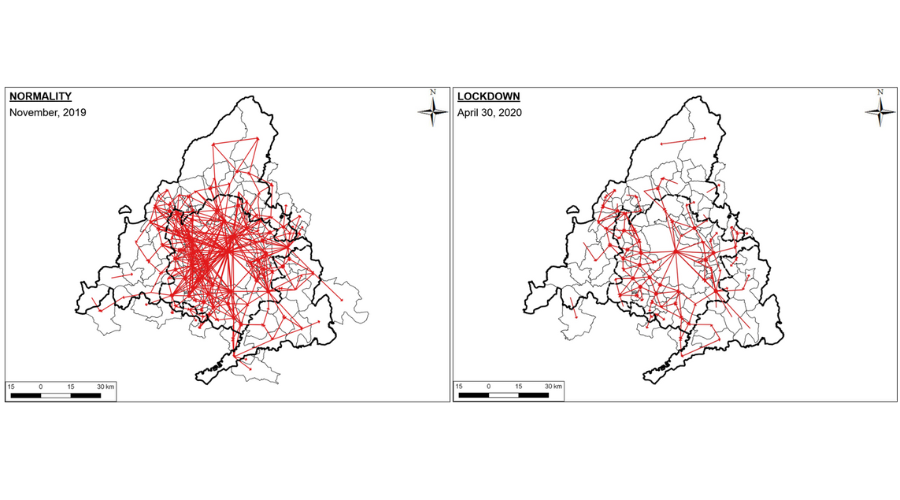
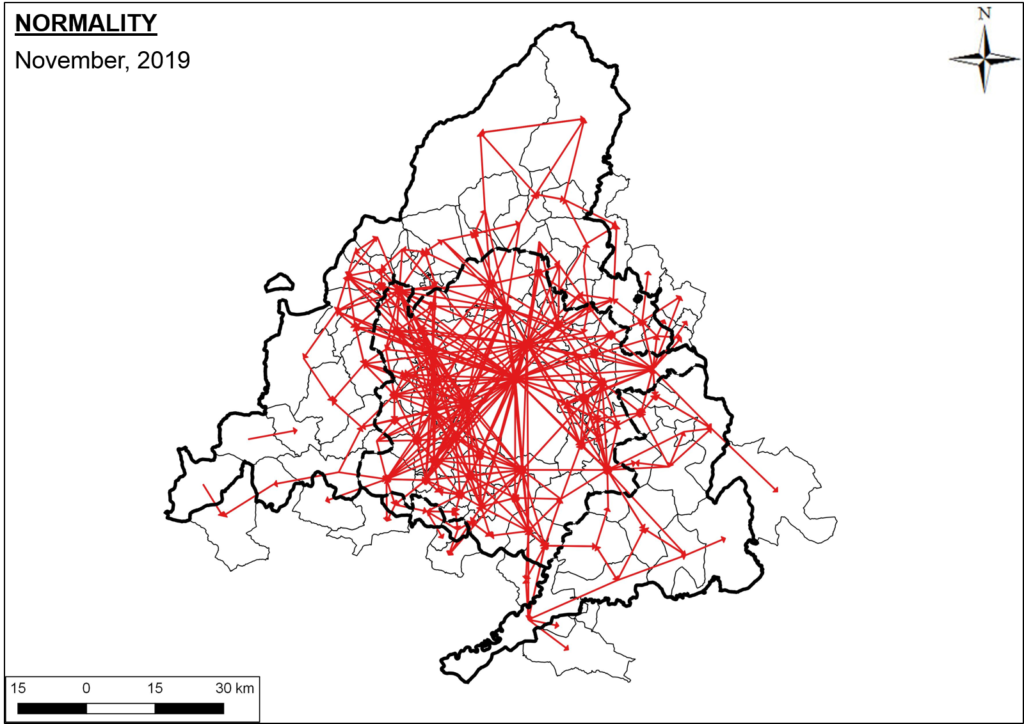
The temporary scope of the offer covers only the state of alarm, in such a way that the data goes from March 16th to June 20th, 2020, along with the reference data for the week from November 18th to November 21st, 2019.
Madrid is one of the most populated regions in Spain and also one of the most affected by this pandemic. It is on that basis that the Region of Madrid had longer restrictions.
The territorial division of the Region proposed by the INE established 293 mobility areas. For the purposes of this study, the mobility areas which are from the same municipality have been unified to create the study areas. In this way, the Region of Madrid will be divided into 102 study areas.
The analysis of the evolution of mobility in Madrid has been based on the origin-destination data provided by the INE by selecting a representative date for each period of the state of alarm:
- Normality: average data from November 18th to November 21st, 2019.
- Lockdown: average data from March 26th and April 30th, 2020.
- Phase 0: May 21st, 2020.
- Phase I: May 28th, 2020.
- Phase II: June 18th, 2020.
In the first place, by analysing the total data, it is observed that during the lockdown the trips made, which were more than one million in the period of normality, fell over a 70%. With the easing of the lockdown, travel increased progressively but did not reach 600,000 trips.
To make the evolution of the relationships of the study areas more understandable in the course of the state of alarm, different flow maps have been made. The first one corresponds to the period of normality and it shows how travel is concentrated in the metropolitan area and the simplicity of the relationships in the provincial area.
During lockdown, the volume of flows was considerably reduced, and it was almost disappeared along the provincial area. The increase in mobility during the easing of lockdown was not associated with a marked increase in relationships, but the existing ones were intensified.
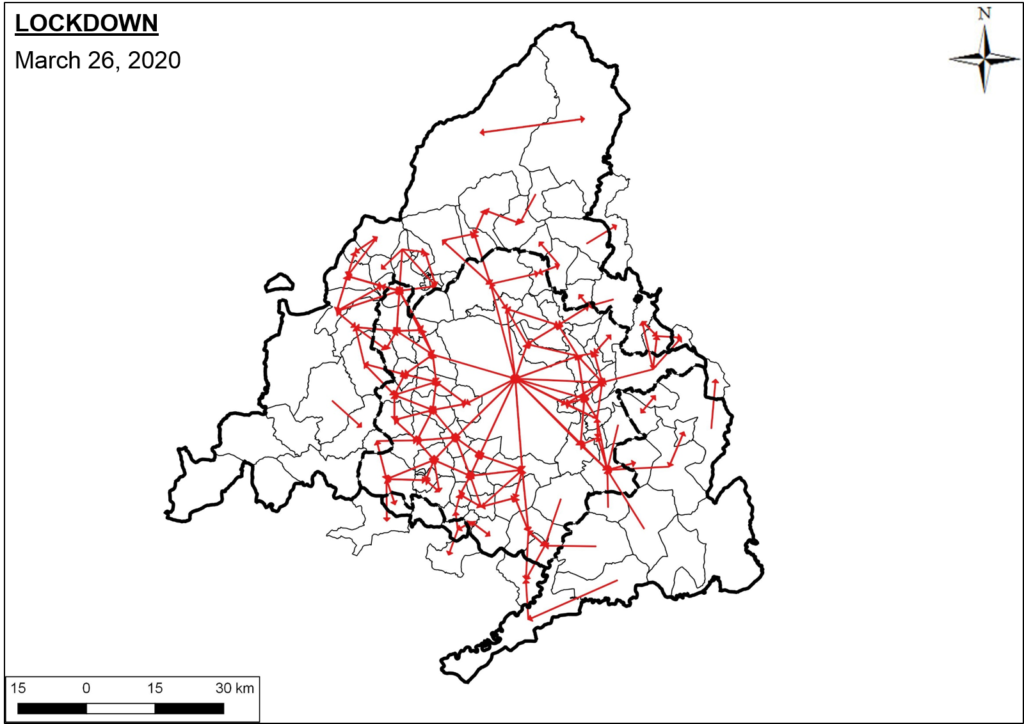
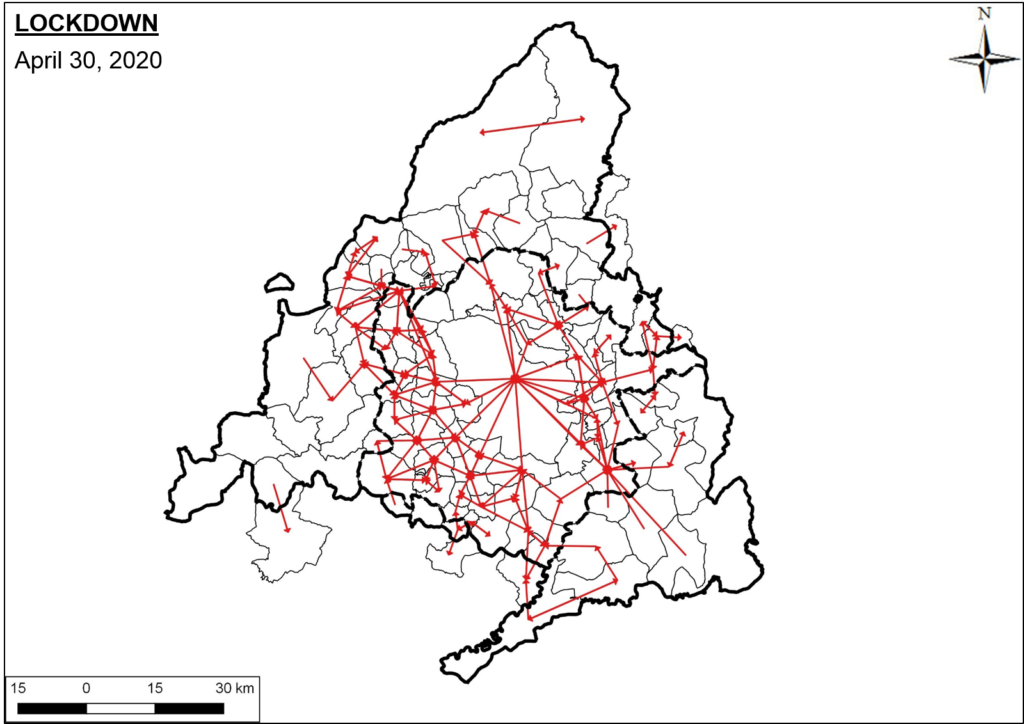

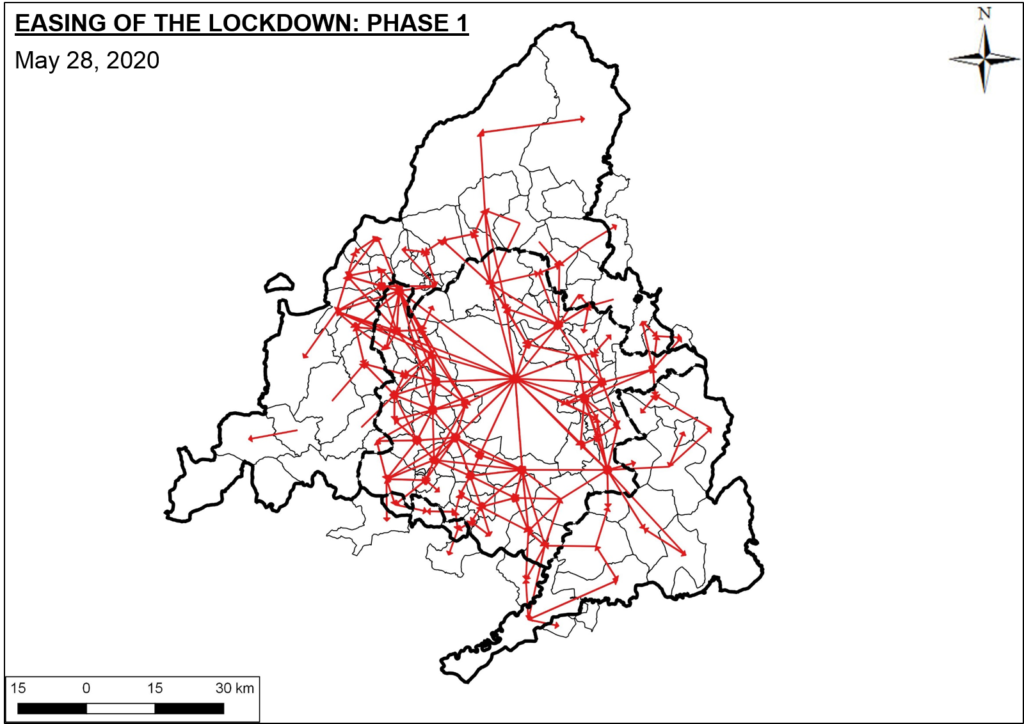
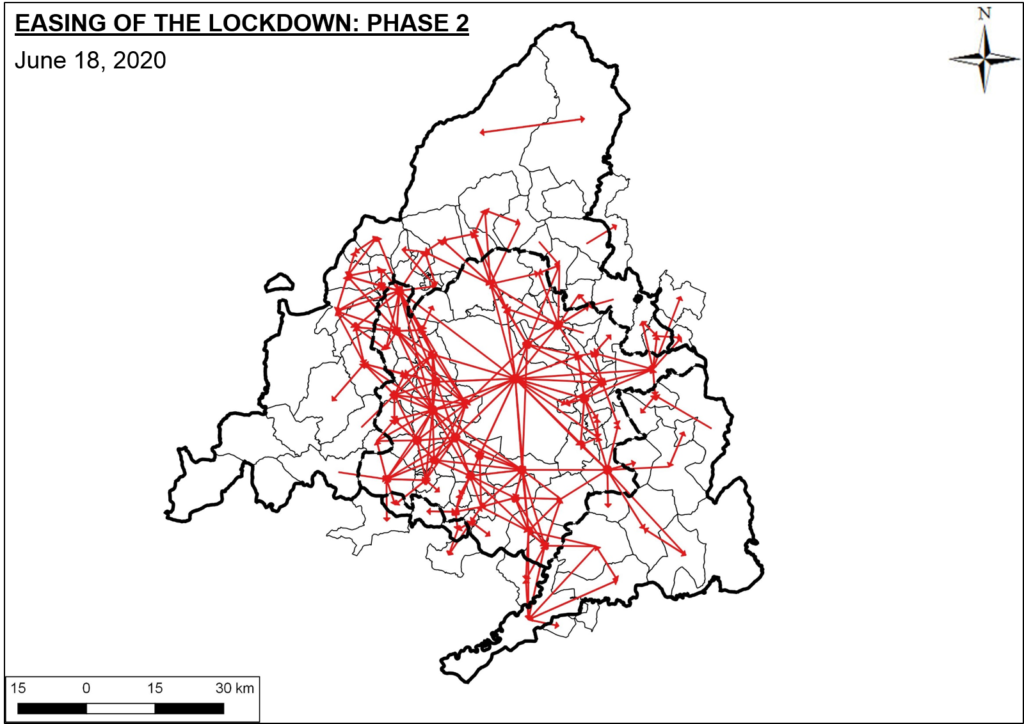
The reduction of outgoing movements during the lockdown was greater in the metropolitan area, in addition to some areas of the Northeast and Southwest of the Region. The increase during the easing of the lockdown was high-moderate within the metropolitan area. In the provincial area there were large increases in the Northern area in contrast with the low increases in the East and West of the Region.
As for the entrance movements, during the lockdown there was a huge decline in the Central and Southeast areas, noting that the Southern areas of the metropolitan area did not suffer major changes. The increase in entrances was generally moderate-high, with high increases in the South.
In order to tackle the condition of restrictions in different areas, different socioeconomic variables, land use and transport data have been studied.
Amongst the socioeconomic variables, data on population density, income per capita and employment data have been taken. The latter are of great interest as the Home Mobility Survey of the Region of Madrid (EDM2018) points out that 20% of the trips are associated with work. These employment figures consist of Social Security members, unemployment rate and branches of activity.
On the other hand, the analysis of land uses constitutes a great indicator of the generation of employment and, therefore, the propensity to travel. Finally, the transport data is based on the motorization index of each area and the evolution of travellers transported by city bus and Metro.
The analysis focuses mostly on employment numbers in view of its close relation with the generation and reception of travel, starting with the study of branches of activity.
Hence, it is observed that the areas in which the majority of the population is engaged in Business and Financial Services (Madrid, Alcobendas, Majadahonda, Pozuelo de Alarcón, etc.) suffered a great drop during the lockdown and moderate increases after it. Similarly, the areas that base their activity on these services lost a large percentage of travel and did not regain mobility largely in the easing. This is explained as the presence of these services was reduced and, following the lockdown, a teleworking regime was adopted.
As for the Distribution and Hospitality Services branch, the areas in which citizens perform these jobs and the areas that base their economy on it were not affected by the lockdown to a great extent and therefore suffered fewer increases in the easing. This dynamic is associated with the high degree of presence of these activities.
Analysing income per capita, it is noted that areas with fewer resources suffered less decreases during the lockdown than high-income areas in terms of mobility. This may reflect unemployment rates in areas with fewer resources, so people who did not go to work did not make as many trips as in pre-COVID-19 times.
In conclusion, this analysis has made it clear that mobility patterns have obviously been greatly affected by the arrival of the pandemic in the Region of Madrid. The lockdown resulted in high decreases in the volume of travel in the Region and with the easing of lockdown there were increases but, in light of the data, the mobility that took place in periods of normality was not recovered.
Delving into these conditions, the study shows that the Region’s mobility patterns are highly conditioned by the employment status quo in the different areas of Madrid. Consequently, the business and financial branch was more affected than the distribution branch, mainly because of the presence associated with each activity. These findings can lead to different strategies, adapted to each branch and study area, to act on the new waves of the pandemic in the future.